Scalping is a trading style specializing in taking profits on small price changes, generally soon after a trade has been entered and has become profitable. It requires a trader to have a strict exit strategy because one large loss could eliminate the many small gains that the trader has worked to obtain. Having the right tools such as a live feed, a direct-access broker and the stamina to place many trades is required for this strategy to be successful.
Scalping is based on an assumption that most stocks will complete the first stage of a movement (a stock will move in the desired direction for a brief time but where it goes from there is uncertain); some of the stocks will cease to advance and others will continue. A scalper intends to take as many small profits as possible, not allowing them to evaporate. Such an approach is the opposite of the "let your profits run" mindset, which attempts to optimize positive trading results by increasing the size of winning trades while letting others reverse. Scalping achieves results by increasing the number of winners and sacrificing the size of the wins. It's not uncommon for a trader of a longer time frame to achieve positive results by winning only half or even less of his or her trades - it's just that the wins are much bigger than the losses. A successful scalper, however, will have a much higher ratio of winning trades versus losing ones while keeping profits roughly equal or slightly bigger than losses.
The main premises of scalping are:
* Lessened exposure limits risk - A brief exposure to the market diminishes the probability of running into an adverse event.
* Smaller moves are easier to obtain - A bigger imbalance of supply and demand is needed to warrant bigger price changes. It is easier for a stock to make a 10 cent move than it is to make a $1 move.
* Smaller moves are more frequent than larger ones - Even during relatively quiet markets there are many small movements that a scalper can exploit.
Scalping can be adopted as a primary or supplementary style of trading.
Primary Style
A pure scalper will make a number of trades a day, between five and 10 to hundreds. A scalper will mostly utilize one-minute charts since the time frame is small and he or she needs to see the setups as they shape up as close to real time as possible. Quote systems Nasdaq Level II, TotalView and/or Times and Sales are essential tools for this type of trading. Automatic instant execution of orders is crucial to a scalper, so a direct-access broker is the favored weapon of choice.
Supplementary Style
Traders of other time frames can use scalping as a supplementary approach in several ways. The most obvious way is to use it when the market is choppy or locked in a narrow range. When there are no trends in a longer time frame, going to a shorter time frame can reveal visible and exploitable trends, which can lead a trader to scalp.
Another way to add scalping to longer time-frame trades is through the so-called "umbrella" concept. This approach allows a trader to improve his or her cost basis and maximize a profit. Umbrella trades are done in the following way:
* A trader initiates a position for a longer time-frame trade.
* While the main trade develops, a trader identifies new setups in a shorter time frame in the direction of the main trade, entering and exiting them by the principles of scalping.
Practically any trading system, based on particular setups, can be used for the purposes of scalping. In this regard, scalping can be seen as a kind of method of risk management. Basically any trade can be turned into a scalp by taking a profit near the 1:1 risk/reward ratio. This means that the size of profit taken equals the size of a stop dictated by the setup. If, for instance, a trader enters his or her position for a scalp trade at $20 with an initial stop at $19.90, then the risk is 10 cents; this means a 1:1 risk/reward ratio will be reached at $20.10.
Scalp trades can be executed on both long and short sides. They can be done on breakouts or in range-bound trading. Many traditional chart formations, such as a cup and handle or triangle, can be used for scalping. The same can be said about technical indicators if a trader bases decisions on them.
Three Types of Scalping
The first type of scalping is referred as "market making", whereby a scalper tries to capitalize on the spread by simultaneously posting a bid and an offer for a specific stock. Obviously, this strategy can succeed only on mostly immobile stocks that trade big volume without any real price change. This kind of scalping is immensely hard to do successfully as a trader must compete with market makers for the shares on both bids and offers. Also, the profit is so small that any stock's movement against the trader's position warrants a loss exceeding his or her original profit target.
The other two styles are based on a more traditional approach and require a moving stock where prices change rapidly. These two styles also require a sound strategy and method of reading the movement.
The second type of scalping is done by purchasing a large number of shares that are sold for a gain on a very small price movement. A trader of this style will enter into positions for several thousand shares and wait for a small move, which is usually measured in cents. Such an approach requires highly liquid stock to allow for entering and exiting 3,000 to 10,000 shares easily.
The third type of scalping is the closest to traditional methods of trading. A trader enters an amount of shares on any setup or signal from his or her system, and closes the position as soon as the first exit signal is generated near the 1:1 risk/reward ratio, calculated as described earlier.
Scalping can be very profitable for traders who decide to use it as a primary strategy or even those who use it to supplement other types of trading. Adhering to the strict exit strategy is the key to making small profits compound into large gains. The brief amount of market exposure and the frequency of small moves are key attributes that are the reasons why this strategy is popular among many types of traders.

Saturday, November 3, 2007
Sunday, August 5, 2007
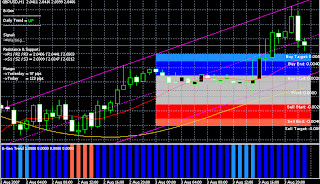
MT4 Indicator (B-gen indicator)
I found this forex indicator from my friend, this indicator help u to find where the buy and sell level. My advice for using this indicator is buy or sell from buy/sell area with TP 20 pips and S/l 30 pips
Download here

Download here
Friday, July 20, 2007
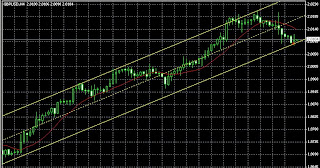
MT4 indicator
Here is one of metatrader indicator that i use for forex trading. this indicator is very useful. it can automatically draw trend for u. so u don't have to draw manually and save ur time to analyze the market
Download here

Download here
Sunday, July 8, 2007
Market Review fo Next week
After BOE increase their rate last thursday GU come down as market exepected. current price is 2.0104, drop from 2.0200. this condition is much affected by technical rather than fundamental, since i can see all indicator say it's already overbought. i'm expecting GU will Come down till 1.9900 area before it continue to move upward till 2.0300. There are some high impact news will be realesed from UK and US. from UK there are PPI Input on moday forcasted to be bad. and also released data fo Trade balance from UK and US. both data will affect the market. choppy market will be expected. next week will be interesting, every issue can ruin all the scenarion. happy trading :)
Wednesday, July 4, 2007
Forex Indicator
There are hundreds forex indicator in Forex. these indicator basically is a script or program writen using program language here are some good forex indicator :
Simple Moving Average (SMA) - The average price of a given time period, (5 minutes, 10 minutes, 1 day, etc.) where each of the chosen periods carries the same weight for the average. Example using the closing prices of the USD/JPY currency pair: Day 1 close = 124.00, Day 2 close = 126.00, Day 3 close = 124.00, Day 4 close = 126.00; The 4-day SMA is 125.00 (the average of the prior four closes).
Exponential Moving Average (EMA) - Here, the averages are calculated with the recent forex rates carrying more weight in the overall average; for example: In a 10-day exponential moving average, the last 5 days will have more effect on the average than the first 5 days. The idea is to use the most recent data as a better indication of trend direction.
Bollinger Bands - The basic interpretation of Bollinger Bands is that prices tend to stay within the upper and lower bands. The distinctive characteristic of Bollinger Bands is that the spacing between the bands varies based on the volatility of the prices. During periods of extreme currency price changes (i.e., high volatility), the bands widen to become more forgiving. During periods of low volatility, the bands narrow to contain currency prices. The bands are plotted two standard deviations above and below a simple moving average. They indicate a "sell" when above the moving average (or close to the upper band) and a "buy" when below it (or close to the lower band). The bands are used by some forex traders in conjunction with other analyses, including RSI, MACD, CCI, and Rate of Change.
Parabolic SAR - The Parabolic SAR (stop-and-reversal) is a time/price trend following system used to set trailing price stops. The Parabolic SAR provides excellent exit points. Forex traders using this technical indicator should close long positions when the price falls below the SAR and close short positions when the price rises above the SAR. If you are long (i.e., the price is above the SAR), the SAR will move up every day, regardless of the direction the price is moving. The amount the SAR moves up depends on the amount that currency rates move.
Rate of Change - The oldest closing price divided into the most recent one.
RSI (Relative Strength Index) - The RSI is a price-following oscillator that ranges between 0 and 100. A popular method of analyzing the RSI is to look for a divergence in which the currency price is making a new high, but the RSI is failing to surpass its previous high. This divergence is an indication of an impending reversal. When the RSI then turns down and falls below its most recent trough, it is said to have completed a "failure swing." The failure swing is considered a confirmation of the impending reversal in the price of the currency.
Stochastics - Stochastic studies are based on the premise that as prices rise, closing prices tend to be near the high value. Conversely, as prices fall, closing prices are near the low for the period. Stochastic studies are made of two lines, %D and %K, that move between a scale of 0 and 100. The %D line is the moving average over a specified period of time of the %K line. The %K line measures where the closing price of a currency is compared to the price range for a given number of periods.
Momentum - Designed to measure the rate of price change, not the actual price level. Consists of the net difference between the current closing price and the oldest closing price from a predetermined period. The Momentum indicator can be used as either a trend-following oscillator similar to the MACD or as a leading indicator.
MACD - Moving Average Convergence/Divergence - Consists of two exponential moving averages that are plotted against the zero line. The zero line represents the times the values of the two moving averages are identical. The MACD is calculated by subtracting a 26-day moving average of a currency's price from a 12-day moving average of its price. The result is an indicator that oscillates above and below zero. When the MACD is above zero, it means the 12-day moving average is higher than the 26-day moving average. This is bullish as it shows that current expectations (i.e., the 12-day moving average) are more bullish than previous expectations (i.e., the 26-day average). This implies a bullish, or upward, shift in the forex rate. When the MACD falls below zero, it means that the 12-day moving average is less than the 26-day moving average, implying a bearish shift in the currency.
ADX - Measures the strength of a prevailing currency trend and whether or not there is direction in the currency market. Plotted from zero on up, usually a reading above 25 can be considered directional.
William's %R - A momentum indicator that measures overbought/oversold levels in the price of a currency. The interpretation of Williams' %R is very similar to that of the Stochastic Oscillator, except that %R is plotted upside-down and the Stochastic Oscillator has internal smoothing. Readings in the range of 80 to 100% indicate oversold, while readings in the 0 to 20% range suggest overbought.
Volatility - Measures the overall volatility of a currency in a given time period.
Saturday, June 30, 2007
Thomas Demark Indicator
The DeMarker indicator is an attempt to overcome the shortcomings of classical overbought / oversold indicators. In Forex The DeMarker Indicator identifies potential price bottoms and tops. It accomplishes this by making price comparisons from one bar to the next and measuring the level of price demand
here is the formula
here is the formula
highm = IIF( H > Ref( H, -1 ), H - Ref( H, - 1), 0 );
lowm = IIF( L < Ref( L, -1 ), Ref( L, - 1 ) - L, 0 );

Tom D = 100 *  Sum( highm, 13 )/( Sum( lowm, 13 ) + Sum( highm, 13 ) );
Tuesday, June 26, 2007
Holy Grail in Forex, is it really exist?
The Holy Grail is often referred to in trading circles as the perfect trading system; the perfect conditions or indicator that will guarantee success in every trade you enter. All traders at some stage undertake the search for the Holy Grail whether it is consciously or subconsciously.
The reality of trading is that there is no such trading system in existence. It never has existed and never will. The fact that some software packages label an indicator the ‘Holy Grail’ only serves to whet the appetite of some people further and arouse their suspicion of what it could be and how they will find it.
It is also widely accepted that your own psychology or mindset is the largest single determinant of your trading success followed by your ability to manage risk. The small remainder of the ingredients to your trading success is your system which includes your entry signal.
When most traders start trading, they spend most of their time on developing their entry conditions. They will learn about various technical indicators, trends and chart patterns, and how they can be interpreted and applied to their trading.
In his book ‘Market Wizards’, Jack Schwager interviews numerous profitable traders in the United States. There is an interesting observation to be made about most of them. Often Schwager asked if they were to start trading again, what would they do differently.
Many answered that they would not have wasted as much time initially on their entry signals and they would have rather spent that time concentrating and developing their risk management rules and working on their own mindset or psychology.
When trading does not go well for most traders though, they begin to wonder what part of their entry conditions is failing them. Thoughts like is it the data they are using, the software, should they use different moving averages like weighted or exponential, or look at hourly data.
It is obvious that entry conditions are a necessary part of any trading plan but their importance is often overrated. Numerous texts have been written about various entry signals yet not enough focus on what is really important to trading.
This may not help the beginner who naturally assumes that their entry signal is the most important part of their trading plan and therefore they shall spend most of their time developing that.
Unfortunately some traders who have looked for the Holy Grail try to lay the blame for their lack of success on external factors. It might be the software they are using or the new entry signal they acquired from reading a book, but at the end of the day they should look no further than themselves.
Successful traders have numerous personal traits in common. They are focussed, disciplined, passionate, and are totally committed to their trading. They are humble and always prepared to learn from their mistakes. The Holy Grail of trading has never existed and never will.
Wednesday, June 20, 2007
Elliott wave
The Elliott wave principle (1871–1948), a professional , or wave principle, is a form of technical analysis that investors use to forecast trends in the financial markets and other collective activities. Ralph Nelson Elliottaccountant, developed the concept in the 1930s, proposing that market prices unfold in specific patterns, which practitioners today call Elliott waves, or simply waves. He published his views of market behavior in the book The Wave Principle (1938), in a series of articles in Financial World magazine in 1939, and most fully in his final major work, Nature’s Laws – The Secret of the Universe (1946). Elliott said that "because man is subject to rhythmical procedure, calculations having to do with his activities can be projected far into the future with a justification and certainty heretofore unattainable."
lliott Wave analysts (or "Elliotticians") say that they may not even need to look at a price chart to determine where a market lies in its wave pattern. Each wave has its own "signature," which often reflects the psychology of the moment. Understanding how and why the waves develop is the key to applying the Wave Principle; that understanding includes recognizing the characteristics described below.
lliott Wave analysts (or "Elliotticians") say that they may not even need to look at a price chart to determine where a market lies in its wave pattern. Each wave has its own "signature," which often reflects the psychology of the moment. Understanding how and why the waves develop is the key to applying the Wave Principle; that understanding includes recognizing the characteristics described below.
These wave characteristics assume a bull market in equities. The characteristics apply in reverse in bear markets.
- Wave 1: First waves are rarely recognized at their inception. When the first wave of a new bull market begins, the fundamental news is just about universally negative. The previous trend is considered still strongly in force. Fundamental analysts continue to revise their earnings estimates lower; most likely, the economy does not look strong either. Sentiment surveys are decidedly bearish, put options are in vogue, and implied volatility in the options market is high. Volume might increase a bit as prices rise, but not by enough to alert many technical analysts.
- Wave 2: Wave two corrects wave one, but can never extend beyond the starting point of wave one. Typically, the news is still bad. As the markets retest the prior low, bearish sentiment quickly builds, and "the crowd" haughtily reminds all that the bear market is still deeply ensconced. Still, some positive signs appear for those who are looking: volume should be lower during wave two than during wave one, prices usually do not retrace more than 61.8% (see Fibonacci section below) of the wave one gains, and prices should fall in a three wave pattern.
- Wave 3: Wave three is usually the largest and most powerful wave in a trend (although some research suggests that in commodity markets, wave five is the largest). The news is now positive and fundamental analysts start to raise earnings estimates. Prices rise quickly, and corrects are short-lived and shallow. Anybody looking to "get in on a pull-back" is likely going to miss the boat. As wave three starts, news is probably still bearish, and most market players remain negative. But, by the midpoint of wave three, "the crowd" will often now be on board with the new bullish trend. Wave three often extends wave one by a ratio of 1.618 : 1.
- Wave 4: Fourth waves are typically clearly corrective. Prices may meander in a sideways pattern for an extended period, with wave four typically retracing less than 38.2% of wave three. Volume is well below than that of wave three. This is a good place to buy a pull back, if you understand the potential for wave 5 ahead. However, possibly the single most distinguishing feature of fourth waves is that they are often very difficult to count.
- Wave 5: The fifth wave is the final leg of a five wave move. The news is now almost universally positive and everybody is bullish. Unfortunately, this is the point when many "average investors" finally buy in, right before the top. Volume is lower in wave five than in wave three, and many technical momentum indicators will start showing divergences (prices reach a new high, the indicator does not reach a new peak). At the end of a major bull market, bears may very well be ridiculed (recall how those calling for a top in the stock market during 2000 were received).
- Wave A: Corrections are typically harder to identify than impulse moves. During wave A of a bear market, the fundamental news is usually still positive. Most analysts see the drop as a correction in a still-active bull market. Some technical indicators that suggest a wave A include increased volume, rising implied volatility in the options markets and possibly a turn higher in open interest in related futures markets.
- Wave B: Prices move back higher, and is seen as a resumption of the now long gone bull market by many. For those familiar with classical technical analysis, the peak would be the right shoulder of a head and shoulders reversal pattern. Volume during a wave B should be lower than seen in wave A. By this point, fundamentals are probably no longer improving, but they most likely have not yet turned negative.
- Wave C: Prices move impulsively lower in five waves. Volume picks up, and by the third leg of wave C, almost everybody realizes that a bear market is firmly entrenched. Wave C is typically at least as large as wave A and often extends to 1.618 times wave A or larger.
Tuesday, June 19, 2007
Trading Advice (G/J)
244.50 cannot hold Gj yesterday, so i open another buy position on 244.40. as i said before if it break that level G/J will continue to rise, probably until 250. my advice is keep buy dips when u see small correction on this pair. do not sell unless u got very positif signal for shorting this beast. stay aware with major correction, don't forget to put ur stop loss. Happy Trading :)
Sunday, June 17, 2007
Daily Pivot Points for June 15 2007
EUR-USD
Open = 1.3310
High = 1.3386
Low = 1.3305
Close = 1.3378
Pivot = 1.3356
Support and resistance for june 18 2007
R1 = 1.3408
R2 = 1.3437
R3 = 1.3489
S1 = 1.3327
S2 = 1.3275
S3 = 1.3246
GBP-USD
Open = 1.9693
High = 1.9779
Low = 1.9688
Close = 1.9752
Pivot = 1.9740
Support and resistance for june 18 2007
R1 = 1.9791
R2 = 1.9831
R3 = 1.9882
S1 = 1.9700
S2 = 1.9649
S3 = 1.9609
Trading Advice (G/J)
GJ now at a very high position. selling this pair will be good if she cannot break 244.40. My indicator say that G/J now is overbought. next week will be a nice drop for this pair. but becarefull, BOJ are hold the interest rate. and not planning to hike interest rate till september. so the overall trend is still Bullish. this down scenario will fail if G/j break 245, in that case we might see 250 very soon
Tips On How To Trade Using Traditional Pivot Points
The simplest way to open position without reading any chart is by using traditional pivot point. but of course u still need confirmation from indicator wether the market trend is UP or Down. here are some ways to Trade using pivot points
- For a Bounce scenario 1; take sell position when the market price touch R1, with S1 as Ur firt Target point and stop lost at R2
- For a Breakout senario 1; take buy position when the market price touch R1, with R2 as Ur first Target point and stop lost at Pivot
- For a Bounce scenario 2; take buy position when the market price touch S1, with R1 as Ur firt Target point and stop lost at S2
- For a Breakout senario 2; take sell position when the market price touch S1, with S2 as Ur first Target point and stop lost at Pivot
Friday, June 15, 2007
Daily Pivot Points for June 14 2007
EUR-USD
Open = 1.3310
High = 1.3324
Low = 1.3279
Close = 1.3310
Pivot = 1.3304
Support and resistance for june 15 2007
R1 = 1.3330
R2 = 1.3349
R3 = 1.3375
S1 = 1.3285
S2 = 1.3259
S3 = 1.3240
GBP-USD
Open = 1.9726
High = 1.9736
Low = 1.9658
Close = 1.9692
Pivot = 1.9695
Support and resistance for june 15 2007
R1 = 1.9733
R2 = 1.9773
R3 = 1.9811
S1 = 1.9655
S2 = 1.9617
S3 = 1.9577
Thursday, June 14, 2007
Daily Pivot Points for June 13 2007
EUR-USD
Open = 1.3302
High = 1.3315
Low = 1.3264
Close = 1.331
Pivot = 1.3296
Support and resistance for june 14 2007
R1 = 1.3329
R2 = 1.3347
R3 = 1.3380
S1 = 1.3278
S2 = 1.3245
S3 = 1.3227
GBP-USD
Open = 1.9742
High = 1.9764
Low = 1.9677
Close = 1.9726
Pivot = 1.9722
Support and resistance for june 14 2007
R1 = 1.9768
R2 = 1.9809
R3 = 1.9855
S1 = 1.9681
S2 = 1.9635
S3 = 1.9594
Wednesday, June 13, 2007
Technical analysis vs fundamental analysis
The main difference between fundamental and technical analysis consists in that technical analysis is the study of charts, trend lines, support, resistance levels and patterns. Technical traders follow this data in order to predict the direction a currency will take. Fundamental analysis includes the analysis and interpretation of global events, economic, political, financial events and other variables that may cause a currency to fluctuate.
Technical Analysis operates on the theory that market prices at any given point in time reflect all known factors affecting supply and demand for a particular market. Consequently, technical analysis focuses, not on evaluating those factors directly, but on an analysis of market prices themselves. This approach theorize that a detailed analysis of, among other things, actual daily, weekly and monthly price fluctuations is the most effective means of attempting to capitalize on the future course of price movements. Technical strategies generally utilize a series of mathematical measurements and calculations designed to monitor market activity. Trading decisions are based on signals generated by charts, manual calculations, computers or their combinations.
While technical analysis concentrates on the study of market action, fundamental analysis focuses on the economic forces which cause prices to move higher, or lower, or stay the same. The intrinsic value is what the fundamentals indicate one currency is actually worth against another currency. If this intrinsic value is under the current market price, then the currency is overpriced and should be sold. If market price is below the intrinsic value, then the market is undervalued and should be bought. Both of these approaches to market forecasting attempt to solve the same problem, that is, to determine the direction prices are likely to move. They just approach the problem from different directions.
A "fundamentalist" studies the cause of market movement, while a technician studies the effect. Most market traders classify themselves as either technicians or fundamentalists. In reality, there is a lot of overlap. Most fundamentalists have a working knowledge of the basic tenets of chart analysis. At the same time, most technicians have at least a passing awareness of the fundamentals. The problem is that the charts and fundamentals are often in conflict with each other. Usually at the beginning of important market moves, the fundamentals do not explain or support what the market seems to be doing. It is at these critical times in the trend that these two approaches seem to differ the most.
Fundamental Analysis is based on the study of factors external to the trading markets which affect the supply and demand of a particular market. It is in stark contrast to technical analysis since it focuses, not on price but on factors like weather, government policies, domestic and foreign political and economic events and changing trade prospects.
Fundamental analysis theorizes that by monitoring relevant supply and demand factors for a particular market, a state of current or potential disequilibrium of market conditions may be identified before the state has been reflected in the price level of that market. Fundamental analysis assumes that markets are imperfect, that information is not instantaneously assimilated or disseminated and that econometric models can be constructed to generate equilibrium prices, which may indicate that current prices are inconsistent with underlying economic conditions, and will, accordingly, change in the future.
Daily Pivot point for June 12 2007
EUR-USD
Open = 1.3357
High = 1.3369
Low = 1.3301
Close = 1.3302
Pivot = 1.3324
Support and resistance for june 13 2007
R1 = 1.3347
R2 = 1.3392
R3 = 1.3415
S1 = 1.3279
S2 = 1.3256
S3 = 1.3211
GBP-USD
Open = 1.9692
High = 1.9783
Low = 1.9688
Close = 1.974
Pivot = 1.9737
Support and resistance for june 13 2007
R1 = 1.9786
R2 = 1.9832
R3 = 1.9881
S1 = 1.9691
S2 = 1.9642
S3 = 1.9596
Tuesday, June 12, 2007
Trading Advice (G/U)
Today UK CPI comes out worse than expected but UK trade balance comes out better than expected. overall news from UK coming out better than forcasted. i believe if today break support at 1.9790 today, then 2.050 is coming out soon this week. buy position is preferable in this pair. have a good trade
Monday, June 11, 2007
Trading Advice
Today UK PPI input come out better than forcasted, previous value was 0.2% and up till 1.2 %. but yet GBP/USD go around 1.9670-1690. My advice is, if it break 1.9720 then consider to go long and if it break 1.9620 then we should go short in this pair. if it go no where. then better to stay out from the market today :)
Daily Pivot point for June 8 2007
EUR-USD
Open = 1.3426
High = 1.3428
Low = 1.3321
Close = 1.3368
Pivot = 1.3372
Support and resistance for june 11 2007
R1 = 1.3424
R2 = 1.3479
R3 = 1.3531
S1 = 1.3317
S2 = 1.3265
S3 = 1.3210
GBP-USD
Open = 1.9771
High = 1.9793
Low = 1.9623
Close = 1.9681
Pivot = 1.9699
Support and resistance for june 11 2007
R1 = 1.9775
R2 = 1.9869
R3 = 1.9945
S1 = 1.9605
S2 = 1.9529
S3 = 1.9435
Sunday, June 10, 2007
Market Review For The Week Ahead
GBP/USD
There are several important news coming out from UK and US next week, there are PPI Input on monday from UK with previous value 0.7%, and forcasted to be down to 0.6 %. and also CPI report on tuesday with value 2.8%, and forcasted to be down to 2.6 %. From US PPI and CPI report on Thursday and friday forcasted to be better.
with all data forcasted for next week, I'm expecting G/U to break 1.9600 before it continus to move downward. but if G/U maintain above 19700, then be ready to reload ur long and 2.0050 will be the target.
Saturday, June 9, 2007
Tips How To Earn Some Money On the Internet
U want to trade Forex but u don't have money to start with? well, before u start trading u might want to get the fund to trade first. here is some tips from me how to earn online.
First, the best way to start earn online is using google adsense. if u have website and want to earn from it. google adsense is the best choice. u can earn on google adsense by impressions on ur site or pay per click. u don't have website yet? it's simple, u can use blogger to start ur blog and put ur google adsense there. all u need to do is prepare ur site and blog, then apply for google adsense here :
After google accept ur adsense account. u need to advertise ur blog or site to get more visitor. and don't forget update it. coz search engine love it.
To lazy to make a site and blog? well there is always anoother method to earn :D. the simplest way is oining pay per post forum. some forum give good money for ur post. here are some good pay per post forum
Goldage forum, in goldage u can get 10 cent per post. i got paid for total $100 in my e-gold account. Join this forum now, they give us $10 for 250 post. follow this link .
code4gold forum is also good forum that always pay. not as much as goldage, but they are good :)
have a good time earn online, and remember to always search for any opportunity :)
Friday, June 8, 2007
Dollar continue to strengthen today
The dollar keep on strengthened because the market continued to respond to yesterday's jump in US Treasury yields, which reflects the growing expectation that US interest rates will remain elevated. this will make US dollar Bullish in the middle term
Good Forex Broker For intermediate Trader
if u think u are not beginner trader anymore, and have some more money. it's good if u step forward and use broker that require u to deposit more than $20. it's good way to train ur mental to trade with more money u deposit. here are some good broker that i know and already used
Norfinance (Use metatrader trading platform)
Northfinance.com allow deposit via visa electron and wire transfer
Spread: from 2 pips.
Minimum deposit — from 100 dollars.
Instant Execution - Quotation system.
They have Credit Leverage of your choice from 1:1 to 1:500 (For deposits not exceeding 100,000 USD).
Realtrader (Use metatrader trading platform)
Realtrader has micro or mini account. mimimum deposit is $20 for micro account. Credit leverage is 1:100. u can deposit via e-gold, webmoney, or wire transfer
Daily Pivot point for June 7 2007
EUR-USD
Open = 1.3498
High = 1.3512
Low = 1.3422
Close = 1.3425
Pivot = 1.3453
Support and resistance for june 8 2007
R1 = 1.3484
R2 = 1.3543
R3 = 1.3574
S1 = 1.3394
S2 = 1.3363
S3 = 1.3304
GBP-USD
Open = 1.9925
High = 1.9943
Low = 1.9747
Close = 1.9771
Pivot = 1.9820
Support and resistance for june 8 2007
R1 = 1.9894
R2 = 2.0016
R3 = 2.009
S1 = 1.9698
S2 = 1.9624
S3 = 1.9502
Thursday, June 7, 2007
Poundsterling falls after BoE leaves rates unchanged
Today BOE announce rates and keep unchange it from 5.50%. this caused GBP collapse all across the board. Market still believe that we would have rate hike to 5.75 % on july 2007. meanwhile. buying dip is still my favourite
'Daily Pivot point for June 6 2007
EUR-USD
Open = 1.3519
High = 1.3538
Low = 1.3485
Close = 1.3497
Support and resistance for june 7 2007
R1 = 1.3528
R2 = 1.3560
R3 = 1.3581
S1 = 1.3475
S2 = 1.3454
S3 = 1.3422
GBP-USD
Open = 1.9930
High = 1.9957
Low = 1.9907
Close = 1.9924
Support and resistance for june 7 2007
R1 = 1.9952
R2 = 1.9979
R3 = 2.0002
S1 = 1.9902
S2 = 1.9879
S3 = 1.9852
How to Calculate Pivot points
Pivot points are very useful if u are intraday trader. Pivot points are a popular tool used by futures traders in all sorts of markets, ranging from equity indices to crude oil. And, sure enough, pivot points are readily applied to trading currency futures.
Pivot points are support and resistance levels derived from the previous period's high, low, and closing values. There are a variety of pivot values with which to trade, including monthly, weekly, and daily values. You could even calculate hourly values. When determining which period to trade with, you've got to consider your time frame as an individual and your particular style. I'll use daily pivot points for the purpose of this article since the focus is day trading.
Daily pivot points give a structure to each new trading day in the currency market. With these values you can use traditional support and resistance techniques to enter and exit trades. But before I get to the strategy, I'll show you how to calculate pivot values.
Pivot Point (PP) = (High + Low + Close) / 3
Resistance 1 (R1) = (2 x Pivot Point) - Low
Support 1 (S1) = (2 x Pivot Point) - High
Resistance 2 (R2) = Pivot Point + (Resistance 1 - Support 1)
Support 2 (S2) = Pivot Point - (Resistance 1 - Support 1)
(Pivot values for several different currency pairs are posted on the TradingMarkets web site every day.)
The pivot values are plotted as horizontal levels which, in turn, serve as support and resistance. The pivot point itself can be thought of as the day's mid-point, or fulcrum. It's where the buyers and sellers meet to determine the day's trend in a currency pair. The support and resistance levels that are plotted around the pivot point are just that: potential support and resistance.
A daily pivot point (in green), S2, S1, R1, and R2 values are plotted on the chart below of the EUR/USD FX future. The chart is a 5-minute interval. Notice how the Euro broke above the pivot point early in the day, and then proceeded to trade up to R1, where it met resistance and gyrated for the rest of the day.
For instant u can use pivot point calculator for free. u can download this calculator in this site
Pivot points Calculator
Wednesday, June 6, 2007
Basic Trading Strategy
Trading strategy is applying technical and fundamental analysis in a trading method, this method (strategy) have to document three things before we can call it strategy:
1- The chart setup.
2- Entry point.
3- Exit point.
Let’s look in these basic elements of any strategy:
1- Chart setup:
Any trading strategy have to start with information about the chart setup of the strategy which include:
- The indicators the strategy uses and their settings
- The time frame of the chart(s) to use.
- The currencies the strategy work with.
Some of strategies extends the basic requirements of the chart setup but it can be less than those three basics.
2- Entry point:
The strategy main approach is persuading you that if you entered the market now and at this point you will be a winner.
The entry points distinguishing between the strategies and it even between the same strategy but different versions or updates.
Some simple strategies requires less than two conditions to occur to trigger the Buy/Sell signals, for example the Moving Average strategy requires only crossing slow and fast moving average indicators.
Complex strategies requires more conditions for more accuracy, however it trades leaser than simple strategies.
3- Exit point:
Entering a trade at the good time is very important thing the strategy, however, exiting the trade is more important than entering the trade.
Ideas like “Let the profit run and cut losses earlier” and “Money Management” making the exiting is a strategy itself.
Exiting strategy have to care about the following points:
1- Stop loss level: When to exit the trade with the minimum loss.
2- Take profit level: When to exit the trade with the maximum profit you can take.
3- Close conditions: The strategy may provide point where the trade have to be close. For example in our simple moving average crossing strategy; if the open position was a result of an up cross of the fast to the slow moving average, the opened position have to be closed when in the cross reversal.
How to Earn From Internet For Nubie
First u need FREE Internet banking accounts to receive payment. consider it as ur bank account but online. usually most program on the net accept payment via e-gold, e-bullion, or liberty reserve. the most famous one is e-gold. u can sign up on e-gold for free in here E-gold. After u make and e-gold account, u can start earn on the internet. u can try earn e-gold using some program, paid per post, paid to read e-mail or other.
Most recommended is paid to post on forum, the best paid on forum is
1.Paid to post on Forum. Goldage forum, in goldage u can get 10 cent per post. i got paid for total $100 in my e-gold account. Join this forum now. follow this link .
You can also get paid by reading e-mails. currenly the best get paid to read e-mails is
2. Donkeymails, there are no minimum payout. u can request ur money when it reach $0.01. join this program now. follow this link
3. Jillsclickcorner is the best paid to click and paid to signup program, u can earn up to $1-2 a week by doing sign up task. u can request payout at $0.1. join this to, follow this link
U can try another program as u like by searching on the internet. but make sure that the program is paying
Good Forex Broker for Beginner Trader
Marketiva (Deposit using e-gold, and e-bullion)

Marketiva allows you to start trading in Forex market with as little as $1! Due to their strict lot specifications, most of other Forex brokers require at least $500 to start with, with marketiva u can trade as low as $1. JOIN NOW GET $5
Marketiva Register Guide
1. Open Account Marketiva Free : OPEN MARKETIVA
2. Upload your photo and Ktp/id card for Identification: IDENTIFICATION
3. Download Streamster Software client, install to your computer.
4. Run Streamter, Login with your username and password.
5. If any questions chatt with Live Support Marketiva.
2. Upload your photo and Ktp/id card for Identification: IDENTIFICATION
3. Download Streamster Software client, install to your computer.
4. Run Streamter, Login with your username and password.
5. If any questions chatt with Live Support Marketiva.
Liteforex (Deposit using e-gold and Webmoney)
LiteForex offers revolutionary trading technology for beginner traders, and lets you start trading in the Forex market depositing just ONE DOLLAR! Your deposit appears in US cents on the Lite group accounts, so you feel like you are trading the same amount in US Dollars. This new technology allows Forex beginners to learn Forex in a REAL life situation with minimal investment!
LiteForex also offers competitive trading conditions for Forex professionals all around the world, and provides a dedicated Forex trading server and experienced customer support as well as analysis of Forex market and a professional affiliate program.
Join Liteforex here www.liteforex.org
LiteForex also offers competitive trading conditions for Forex professionals all around the world, and provides a dedicated Forex trading server and experienced customer support as well as analysis of Forex market and a professional affiliate program.
Join Liteforex here www.liteforex.org
Tuesday, June 5, 2007
What Is Forex?
FOREX or The Foreign exchange rate market is an international market where various currency exchange transactions take place; this is in the shape of simultaneously buying one currency and selling another. The most commonly traded currencies are referred to as “Majors”; over 85% of daily transactions on Forex trading involve the Majors. These seven currencies are the US Currency (Dollar, USD), Japanese Yen (JPY), Euro (EUR), British Pound (GBP), Swiss Franc (CHF), Canadian Dollar (CAD) and Australian Dollar (AUD). The Forex system in operation today was established in the 1970s when free currency exchange rates were introduced, this period also saw the US Dollar overtake the British Pound as the benchmark currency. Prior to this and in particular during World War II, exchange rate remained more stable.
Forex trading in simplest terms is the buying of one currency and the selling of another. Forex trading, also referred to, as “FX” is open to corporations, small businesses, commercial banks, investment funds and private individuals, it is the largest financial market in the world averaging a daily turnover of over $1 trillion dollars, making it a diverse and exciting market. It is a 24-hour market enabling it to accommodate constant changing world currency exchange rates . According to New York time, trading begins at 2.15pm on Sunday in Sydney and Singapore and progresses through to Tokyo at 7pm, London at 2am and reaches New York at 8am. This leaves investors free to respond to global political, economic and social events when they take place, day or night.
Forex trading in simplest terms is the buying of one currency and the selling of another. Forex trading, also referred to, as “FX” is open to corporations, small businesses, commercial banks, investment funds and private individuals, it is the largest financial market in the world averaging a daily turnover of over $1 trillion dollars, making it a diverse and exciting market. It is a 24-hour market enabling it to accommodate constant changing world currency exchange rates . According to New York time, trading begins at 2.15pm on Sunday in Sydney and Singapore and progresses through to Tokyo at 7pm, London at 2am and reaches New York at 8am. This leaves investors free to respond to global political, economic and social events when they take place, day or night.
Forex is an interbank market that was created in 1971 when international trade transitioned from fixed to floating exchange rates. Since then the rates of currencies relative to each other are determined by the most obvious means which is the exchange at a mutually agreed rate.
This market surpasses the others in its volume. For example, the daily turnover of world securities market is estimated at $300 billion, while Forex approaches 1 to 3 TRILLION US dollars in the same amount of time.
However, Forex is not a market in a traditional sense. It doesn't have a fixed location of the trading floor as, for example, futures market does. The trading is done over the telephone and at the computer terminals in hundreds of banks around the world simultaneously.
Futures and securities markets have one more significant feature distinguishing them from Forex, and at the same time restricting them. The trading is suspended at the end of each day and resumed only next morning. Thus, should certain significant developments occur in the USA, the opening of Russian market next morning could quite surprise you, if you're trading there.
Forex is open 24 hours a day, and the currency exchange operations are maintained throught working days of the week. Almost every time zone (London, New York, Tokyo, Hong Kong, Sydney) has dealers willing to quote currencies.
Subscribe to:
Posts (Atom)


